
Calculator 02 · Teal
Payback Period Calculator: when does solar actually break even?
Not the salesperson’s version — yours. Enter your real quote, only the incentives you genuinely qualify for, and your electricity rate. We compound rising prices and ageing panels year by year until the system has paid for itself.
Calculate payback
live results
State avg, editable
State/local only — see note
Assumes exported energy is valued at the full retail rate (true net metering). If your utility pays less for exports, your real payback is longer — model that precisely in the 25-Year Savings Projector.
Data basis: your state’s average peak sun hours and rate, your price per watt, 3%/yr price escalation and 0.5%/yr panel degradation, compounded year by year. Runs entirely in your browser — no sign-up, no email needed.
Break-even detail
Net profit after 25 years — cumulative savings minus your net cost, including 0.5%/yr panel degradation.
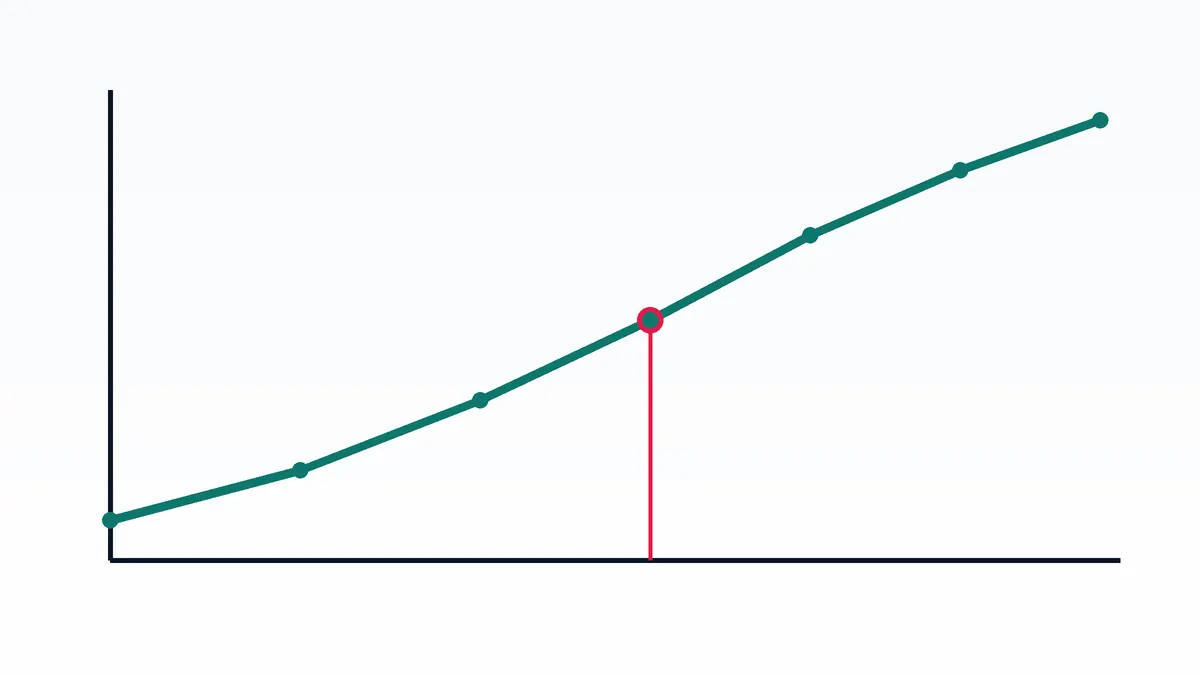
| Cumulative savings by year 5 | $11,466 |
| Cumulative savings by year 10 | $24,430 |
| Cumulative savings by year 15 | $39,087 |
| Cumulative savings by year 20 | $55,657 |
| Cumulative savings by year 25 | $74,392 |
What this calculator is
The Payback Calculator answers the only financial question that matters first: in which year does the money you’ve saved on electricity equal the money you spent? Everything after that year is profit (minus maintenance). It models the two forces sales brochures usually flatten: electricity prices rise every year, which makes each year’s savings bigger — and panels degrade about 0.5% a year, which makes each year’s production slightly smaller.
How it works
The tool estimates year-1 production from your state’s sunshine, then walks year by year: production shrinks by the degradation rate, the electricity price grows by your escalation rate, and the year’s bill savings accumulate until they cover the net cost. The break-even point is interpolated within the final year, so “9.4 years” means the system pays for itself about five months into year ten.
Worked example (real numbers)
Where the installed dollar goes
When you are checking a quote against this calculator, it helps to know what the price is actually made of. Published industry cost breakdowns of a typical residential installation put the shares roughly like this:
| Component | Share of installed price |
|---|---|
| Panels (modules) | ≈12% |
| Labour & installation | ≈30% |
| Inverter | ≈10% |
| Racking, wiring, permitting, overhead, sales cost & margin | ≈48% |
The surprise in that table is the first row: the panels are the small part. Labour and the cost of selling the system are the big parts — which is why two quotes for the same roof can differ by thousands. (Our per-watt pricing guide breaks the same dollar down into $/W component bands.)
Limitations
- Export valuation is the big one. This tool values every generated kWh at the full retail rate, true only under 1:1 net metering. Under net billing (California, Arizona, Hawaii and a growing list), exported energy earns less and payback stretches — use the Savings Projector’s export-credit setting for those states.
- No financing costs. A loan’s interest and dealer fees (often 15–30% baked into financed quotes) lengthen payback substantially. Enter the financed total price per watt if you’re borrowing.
- Maintenance excluded. Budget roughly $150–$300/yr averaged over the life (cleaning where dusty, monitoring, one inverter replacement around year 12–15 at $1,800–$3,000).
- Escalation is an assumption, not a promise. US residential rates rose ≈3%/yr over the long run but with wild state variation. Test 0% and 5% to see your range.
Common mistakes
- Counting incentives you don’t qualify for — income caps, programme budgets and post-2025 federal changes void many brochure figures.
- Using the quote’s “estimated production.” Some installers model with a 0.95+ performance factor. Cross-check production with the state-sunshine maths in our size calculator.
- Comparing payback across financing types. A lease never “pays back” — you never own it. Compare ownership maths to ownership maths.
- Forgetting the roof. If your roof needs replacing in 5 years, add removal/reinstall ($1,500–$3,000) or re-roof first — either way the payback clock changes.
Questions about payback
- What payback period is “good” in 2026?
- Under 10 years is strong, 10–13 is typical for cash purchases at fair prices, beyond 15 needs a non-financial reason (resilience, values) or a cheaper quote. Panels are warranted for 25 years, so any payback well inside that leaves profit years.
- Does a faster payback always mean a better system?
- No — a tiny system can pay back in 6 years while saving little overall. Read payback alongside 25-year net profit, and size to your usage first.
- Should I include the value solar adds to my home?
- Studies (including US Department of Energy research) find owned systems add a resale premium, but we deliberately exclude it: it’s real only when you sell, and it varies by market. Treat it as a bonus, not a pillar of the decision.
Rates, prices and incentive rules on this page checked November 2026.
Disclaimer: planning estimates only — not financial advice, not a quote, not a guarantee of savings. Verify incentives against current federal and state rules before signing any contract.
Keep reading: is solar worth it in 2026?
The full honest version — who solar clearly pays for now that the federal credit is gone, who it doesn’t, and the five numbers that decide it.
Read: Is Solar Worth It in 2026? The Honest Maths → Also: 9 sales traps that wreck payback →